Least Popular homes for sale

Wednesday, July 1, 2015

Recently Sold Homes Milpitas CA June 2015

Recently Sold Homes Milpitas CA June 2015

Milpitas, CA Homes for Sale have seen steady price improvement month to month as well as year to year as inventory levels remain at all-time lows.

This Months Most Expensive


The most expensive of allMilpitas, CA Homes for salethis month is listed at$2,499,900and includes 5bedrooms, 5bath and has 5,903sqft. (schedule a showing).


This Months Least Expensive


The least expensive of allMilpitas, CA homes for salecame in at$399,000and would be a great home for a first time homebuyer or an investor looking for a rental property with positive cash flow. It has 1 bedrooms and 1 bath with 932 sqft and could use a little updating (schedule a showing).


The Numbers Month to Month and Year to Year

Compared To Last Month
  • Median home prices improved by 3.4% to $912,000 from $882,000
  • The average home sales price rose by 7.8% to $921,441 from $854,925.
  • Home sales down by 28.1% to 23 from 32.
  • Active listing increased 25.9% to 68 from 54.
  • Sale price vs. list price ratio dropped by 2.6% to 105.6% from 108.4%.
  • The average days on market increased by 45.2% to 28 from 19.
Year-Over-Year
  • Median home prices increased by 13.6% year-over-year to $912,000 from $802,500.
  • The average home sales price rose by 7.8% year-over-year to $921,441 from $855,054.
  • Home sales fell by 11.5% year-over-year to 23 from 26.
  • Active listings rose 3.0% year-over-year to 68 from 66.
  • Sale price vs. list price ratio rose by 2.0% year-over-year to 105.6% from 103.5%.
  • The average days on market rose by 17.9% year-over-year to 28 from 24.


Click to see the full report

Below are highlight properties for Recently Sold Homes Milpitas CA June 2015. See more at the full report:

Highlights Photos Maps & Local Schools
Status: Just Sold
150 Valmy St.
$$520,000
3 BEDROOMS
2 BATHROOMS [ 2 FULL ]
LISTING MLS ID: 81470784

Status: Just Sold
1660 Edsel Dr
$$660,000
3 BEDROOMS
2 BATHROOMS [ 2 FULL ]
LISTING MLS ID: 81467395

Status: Just Sold
1332 Acadia Ave
$$688,000
3 BEDROOMS
2 BATHROOMS [ 2 FULL ]
LISTING MLS ID: 81460315

Status: Just Sold
369 Marylinn
$$725,000
3 BEDROOMS
2 BATHROOMS [ 2 FULL ]
LISTING MLS ID: 81466524

Status: Just Sold
1260 Stardust Way
$$815,000
3 BEDROOMS
2 BATHROOMS [ 2 FULL ]
LISTING MLS ID: 81466461

Status: Just Sold
1143 Sunrise Way
$$850,000
3 BEDROOMS
2 BATHROOMS [ 2 FULL ]
LISTING MLS ID: 81466325

See the Full Recently Sold Homes Milpitas CA June 2015


Search ALL San Jose Homes HERE

Search ALL Fremont Homes HERE

Search ALL Milpitas Homes HERE

Search All Gilroy Homes HERE

Search ALL Morgan Hill Homes HERE

Thinking of Selling? Get your home value TODAY

Mortgage & Refinance

Tafoya Real Estate & Home Sales
ALL HOMES
408-753-7773
uatafoya@gmail.com


Information valid as of July 1, 2015. Please contact us for the most current information and status of these properties.

Thursday, February 5, 2015

Milpitas Real Estate Market Update January 2015

Milpitas Real Estate Market Update January 2015

Contact Alex Urbano Tafoya - Broker at 408-753-7773 or Alex@MyMilpitasHome.com to know more about Milpitas Real Estate 


January is showing a healthy and stable real estate market for the city of Milpitas, CA. The median home price has increased to $825,000 compared to last months $800,000. This being more likely of the result of the newly built homes being sold in the city of Milpitas. Overall the average sale price is relatively the same as the median home price. One very important statistic to look at specially if you're a home owner is the Sales Price vs. List Price. The sale price vs. list price is tilting back to less than 100% which means that sellers will have to compete to sell their home a the highest price possible. Currently the sales price vs. list price is 99.1% which is relatively still very good for sellers.


Let's break down the current stats for Milpitas Real Estate Market Update January 2015,

  • Median Home Price - The increase of $825,000 for a home has increased 3.1% from last month
  • Average Sale Price - The actual sold price has increased by 2.6%
  • Number of Homes SOLD - This dropped for the month of January (typical) from 28 to 10 homes.
  • Pending Properties - 24 homes went pending or in contract compared to 23 last month
  • Foreclosures Sold - No sold foreclosures in the city of Milpitas for January or last December
  • Short Sales Sold - There were not short sale listed homes for January or last December
  • Active Listing - New homes for sale came on the market a total of 17 for January 2015
  • Active Foreclosures - There was 1 foreclosure that was listed for the month of January 2015
  • Active Short Sales - No short sales were listed for the month of January 2015
  • Sales Price vs. List Price - This is showing that a home for sale is only getting 99.1% of the asking price.
  • Average Days on Market - Indicates how long it takes for a home to sell, right now it's currently at 50 days for the month of January 2015.
That's the break down of the stats for Milpitas Real Estate Market Update January 2015, if you want to find out what your home will sell for in todays market get a free no obligation home evaluation here. 
Contact Alex Urbano Tafoya 408-753-7773 or Alex@MyMilpitasHome.com to know more about Milpitas Real Estate trends or to get a current Milpitas Real Estate Market update visit www.MyMilpitasHome.com


Wednesday, February 4, 2015

Are home prices falling in Milpitas?

Are Home Prices Falling in Milpitas?


Home prices have been tilting for the past couple of months. What does this mean? Well, it can only mean 3 things.

One, it can mean absolutely nothing given the fact that there is still much demand for homes in the area of Milpitas. This demand is due in part of the growing number of jobs that have been held steady for the past couple of years, most coming from the high tech companies. With new jobs or job relocation some people have found that it makes more sense to buy a home then to rent a home given that the payment for one or the other is very much similar, but buying the home is a much better investment for most people.

Two, it could mean that we are finally adjusting from a highly competitive Milpitas real estate market. Within the past few years starting in 2011 the Milpitas real estate market became an investors dream and at the same time the Milpitas Real estate market was an opportunity for many first time home buyers. Because there were many distressed properties and the interest rates were low both investors and first time home buyers clashed driving the home prices higher and higher each year until recently.

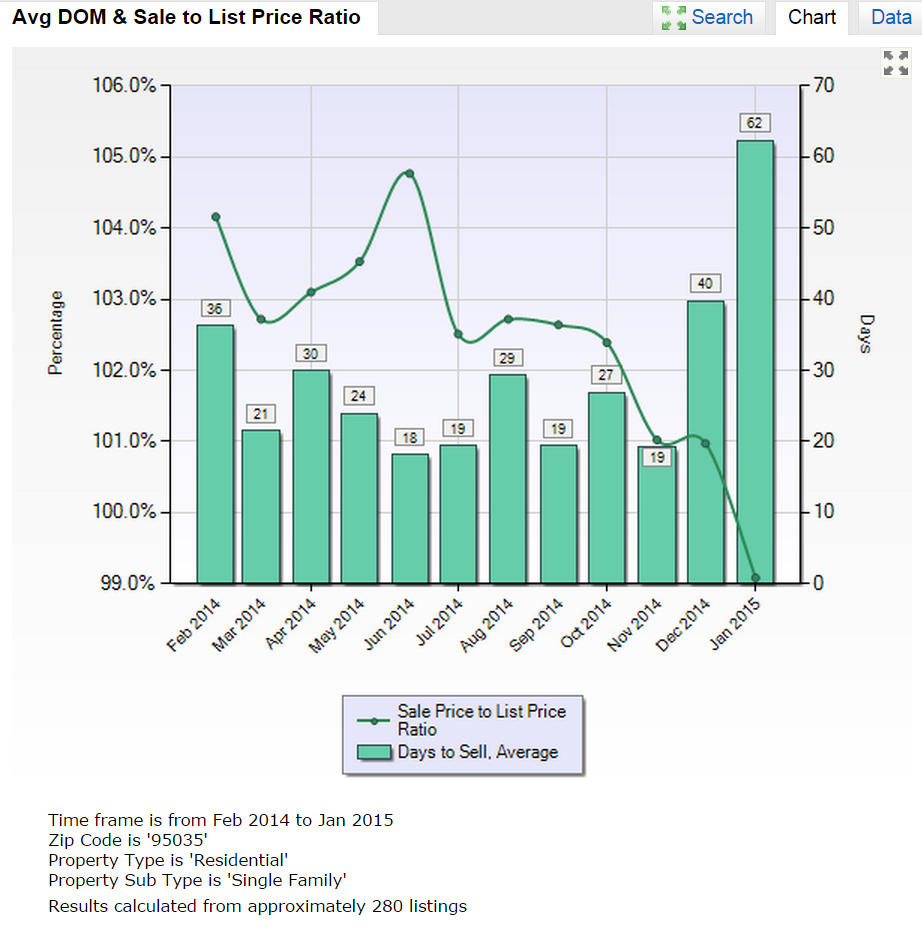
Three, it could possibly mean that we are at the tip of the market shift and we are now seeing the scales tilt towards home prices dropping. Home prices will eventually drop, but this time when they do it will not be like the previous crisis we faced back in 2007 and 2008. This time it will be a gradually. Currently the homes in Milpitas have been maintaining their value, most sellers usually get the price towards what they are asking for their home. For most of last year sellers were receiving at least 3% over the asking price. Now we are seeing that the list price is not the same as the sold price which according to recent sales most sellers are getting 99.1% of the asking price. This is a difference of 3.9%.


Find out what the value of your home is today

So Are home prices falling in Milpitas? I'll let you decide. See the charts above for yourself. This shows the average days that a home stays on the market as well as the sale price to list price ratio. Currently the average days on the market is 62 days, that's almost double compared to last years days on the market of 36. The current ratio of list to sale price is 99% this is compared to last years 104%

Contact Here if you have questions regarding the current value of your home.